Cashflow forecasting is a critical component of project management. Each project operates with its own balance sheet, with its own cash cycle based on costs of activities related to the project. Project managers need reliable predictions about how much cash will be needed at defined intervals based on length of tasks and cost of work completed. Projectmates cashflow forecast uses a “Cash-Out” forecasting model to assist planning for future expenses.
The Projectmates forecasting model is designed to learn from existing data (from manual input or from invoice data) making predictions more realistic and accurate. You can save data to an Excel spreadsheet for reference.
Cash Flow Forecasting needs five values for measurable results: Start Date, Finish Date, Total Cost, Anticipated BCWS (Total Cost) and Subcontract Invoice. This information can be added manually from the View/Edit Budget log (See Editing Budget Sub-items) or imported using MS Excel. |
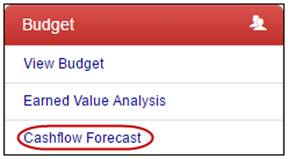
To access the Cashflow Forecast module: 1. Click the Budget button in the navigation frame. |
|
2. Click the Cashflow Forecast link in the left-side menu. |
|
Before forecasting begins, a few user-defined settings must be applied.
To define forecasting settings: 
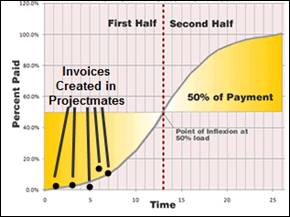
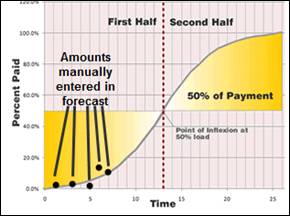
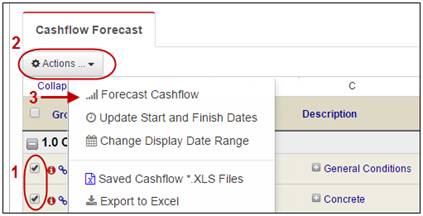
1. Mark the check boxes for sub-items with the same type of forecast. Note: Refer to Types of Forecasts for more information. 
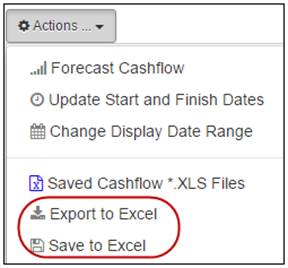
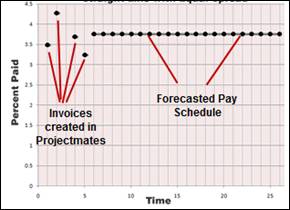
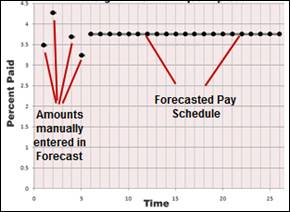
2. Click the Forecast Cashflow link from the Actions drop-down. |
|
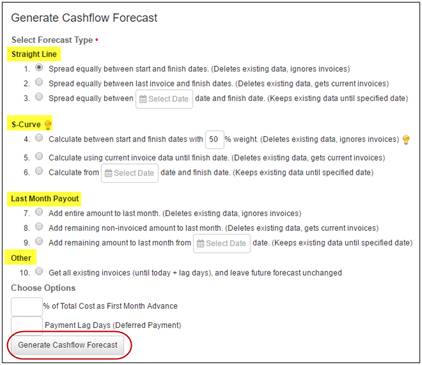
The General Cashflow Forecast pop-up displays with several options.
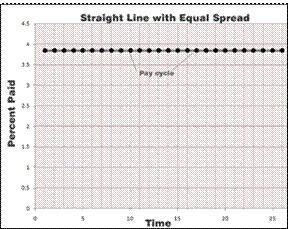
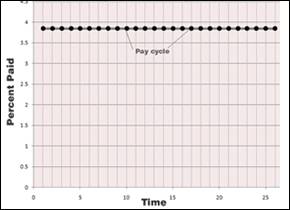
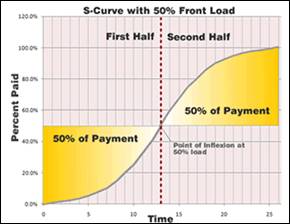
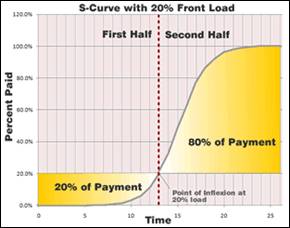
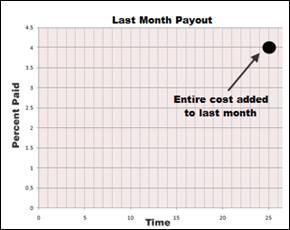
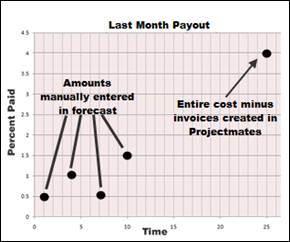
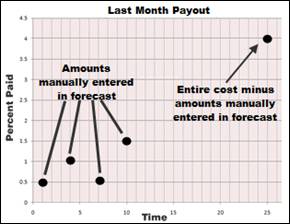
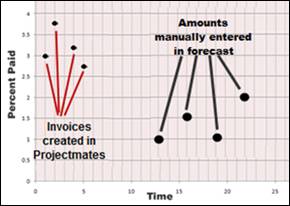
3. First, determine if the forecast should be Straight Line, S-Curve, Last Month Payout, or Other. Note: You can learn more about the different types of forecasts available in Projectmates by referring to the Types of Forecasts section. 4. Optionally, enter the Total Cost as First Month Advance percentage. 5. Optionally, enter the number of Payment Lag Days for deferred payments. 6. Click the Generate Cashflow Forecast button. 
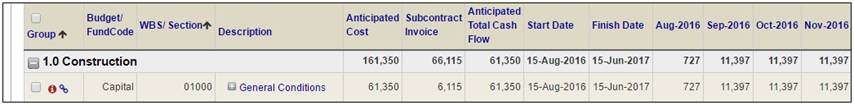
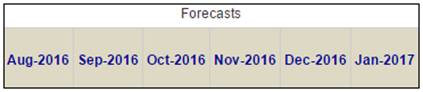
7. Close the Generate Cashflow Forecast window and the updated forecast will display. |
The default cashflow forecast display can be changed. Any changes made to the display range will affect all users viewing the Cashflow Forecast. |
To change the cashflow display: 1. Click the Cashflow Forecast link in the Budget left-side menu. |
|
2. In the Actions drop-down, click the Change Display Date Range link.
The Change Date Range to Display Cashflow pop-up displays. |
|
3. Select the start date and the number of months, quarters, or years to display. 4. Click the Update button. 5. Close the pop-up. |
|
The Forecasts columns will now display the date range you selected. |
Exporting and Saving Forecasts
Cashflow forecasts can be exported to MS Excel and saved in Projectmates for future reference.
To export a forecast on your computer in Excel format: 1. From the Action drop-down, click the Export to Excel link. 2. The file will be downloaded to your computer according to your browser settings. 3. Open the file in Excel for viewing.
To save a forecast in Projectmates: 1. From the Action drop-down, click the Save to Excel link. 2. Enter a name for the forecast. 3. Click the Save button. Note: Regardless of the displayed date range, the entire forecast, from the first start date until the last end date, will be exported to Excel or saved in Projectmates. |
|
To view a forecast saved in Projectmates, from the Action drop-down, click the Saved Cashflow *.XLS Files link.
The list of all saved forecasts for that project will be displayed. |
|
To View or Download a forecast saved in Projectmates: 1. Click the Download link for the appropriate saved forecast. 2. The file will be downloaded to your computer according to your browser settings. |
Straight Line with Equal Spread:
The Anticipated Cost) amount is spread equally each month between the start and finish months based on the type of straight line forecast selected. |
|
Types of Straight Line Forecasts: 1. Spread equally
between start and finish dates |
|
2. Spread
equally between last invoice and finish dates Note: This option will delete any existing data that was manually entered into the forecasted months. |
|
3. Spread
equally between a given date and the finish date |
The S-Curve represents cumulative project cost plotted against time, which in practice follows the shape of the letter "S".
The beginning represents a slow, deliberate but accelerating start, while the end represents a deceleration as the work runs out. |
|
Types of S-Curve Forecasts: 1. Calculate between
start and finish dates with 20% weight (front loaded) |
|
2. Calculate
using current invoice data until the finish date Note: This option will delete any existing data that was manually entered into the forecasted months. |
|
3. Calculate
from a given date and finish date |
This method calculates Anticipated BCWS amount based on amount of current sub-contract invoices submitted and adds it to the last month. |
|
Types of Last Month Forecast: 1. Add entire amount
to last month |
|
2. Add
remaining non-invoiced amount to last month Note: This option will delete any existing data that was manually entered into the forecasted months. |
|
3. Add
remaining amount to the last month from a given date |
This method considers invoices entered through Projectmates and leaves remaining months intact. Note: This option will not alter any existing data that was manually entered or previously forecasted for future months. |